Literacy Comic Reflection & Drafting Process

When I first was told of this assignment, I immediately knew I wanted to incorporate this aspect. I initially thought I would stay close to the text, but after going over sketching and outlining I decided to take a lighter approach. Unlike the comics we have read for class thus far, I chose to incorporate color. Whenever I think back to my youth, I had always associated comics with superheroes and bright colors, so I wanted to do so in my own comics. One thing I didn’t anticipate in regard to coloring is the sheer amount of time it takes to properly shade in a panel; let alone sketching. All in all the time spent on each panel was a little over an hour. However, there was no burden in completing this assignment. I can honestly admit this was the first time, I have ever felt in any capacity like a true artist. It has been extremely gratifying and has allowed me to garner great respect even for the lowest of craftsman. If nothing else, I have a new found admiration for artists dedication and frequent excellence.

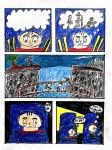
Returning my own experience, I wanted the comic to be lighthearted and imaginative. I wanted to challenge myself by limiting speech to its absolute concision. In doing so, I was required to carefully draw and shade. I chose predominantly primary colors in order to highlight each of the different aspects within the panels. I was somewhat limited in the number of shades I had, but chose the most fitting for each section.

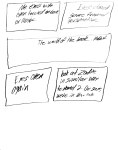
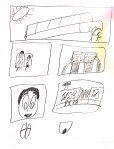
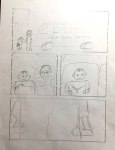
In regard to story structure, I did my best to ensure its simplicity due to the comic’s lack of linguistic expression. I began the story right outside the tour bus, so the reader would understand some background and help guide the time lapse. I then took the story into their seats where the main character would spend the most of his time. The first seated panel depicts a breaking off of a likely previous conversation in order for either individual to read or relax. The next panel focuses in on the main character opening the book and a new world. The large bottom panel then shows the book emanating light as if commencing a magical encounter. The next page begins with a panel showing his imagination bubble emerging, but not with any content yet. The subsequent panel depicts the main character closing his eyes after reading the material, and envisioning people from the story. The large middle section shows the main character transported to the world of the story in a large landscape. After that, the character is nudged awake then told they have arrived in New York.

Literacy Narrative Comic Final Draft

In the process of finalizing my literacy narrative comic I tried to use as much color as possible. I didn’t want to leave white space unless I absolutely had to do so. Because most of my backgrounds were somewhat minimalist, and because I generally like the way that that looks in my art, I decided to fill in with color instead of setting and objects. I identify periods of my life in colors, and so I decided that drawing these kinds of aura/ color-halos around my characters felt like the most emotionally truthful I could be about my own experiences.

Much of my initial draft stayed the same, because I felt like I had spent a good chunk of time on the initial draft, but the process of adding color and inking in lines still ended up adding something substantial to the story, I think. The last panel in this narrative is one of my favorites and I am glad I got to end with it.

Full Final Draft in PDF Format

Sketch 11: Assemblies

Due: 4/29

Tag: sk11

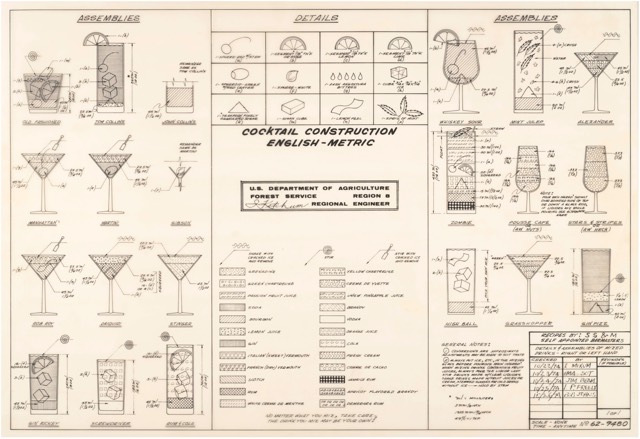
For some unknown reason, the National Archives includes a document entitled Cocktail Construction Chart, which was created by the US Forest Service in 1974, showing recipes for a group of cocktails represented in the style of an architectural diagram.

For this week’s sketch, think about the work you’ve completed in this class and your own learning and thinking processes — then break all that down into component parts, represented in some sort of an architectural diagram like this one. I’m less interested in the quality of the drawing itself and more in your analytical ability to break down something complicated into a series of steps and to represent that as if in such a diagram.

Sketch 10: Data Visualization from Everyday Life

Due: 4/22

Tag: sk10

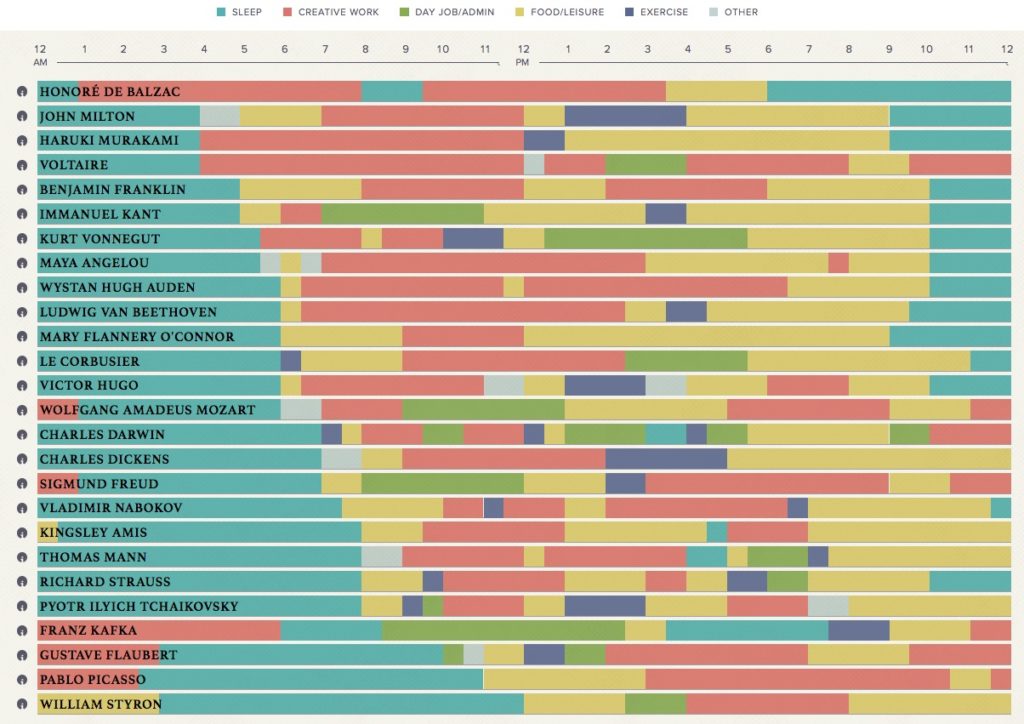
When Mason Currey wanted to understand how he could manage to produce more creative work despite the challenges of everyday life, he set about studying how a bunch of other famous creative people organized their daily lives and what routines they established for their own creative work with the assumption that there were valuable lessons there. Daily Rituals was the result of that research — and then a number of different people and organizations have set out to visualize the insights of that book so that we can see larger patterns in the midst of all this biographical information. Podio’s graphic, which is the feature image on this post, is one of those (check out their site for the interactive version)

For this sketch assignment, you will choose one concept in your life that you want to analyze, something that is not already easily and obviously measured, or doesn’t vary within the span of a day or a week (good categories: awesomeness, mindfulness, healthiness, creativity, productivity, and similar … bad categories: number of steps, hours of sleep, caloric intake, how good is my eyesight?). Decide on a set of about 5 categories that you can use to measure that concept in your life and track those categories for a week or more, then you will produce a visualization of the data that you have gathered and use that visualization to help you understand something about your own life that might not be obvious from your own day to day activities.

Tracking Data

If you’re looking for suggestions about what to track, browsing the “quantified self” tag at Lifehacker might be worthwhile.

Once you’ve got categories, create a spreadsheet where you can track those categories throughout the day. Either take notes in a journal or on your phone and enter the results into your spreadsheet at set intervals, or make the spreadsheet in Google Drive and access it from your phone, or use the site Trackthisforme, or install a tracker app on your mobile device (I found some by searching for “quantified self” apps).

In “How to Track Everything in Your Life Without Going Crazy” and “Fill Out This One-Minute Form Every Day and Find Out Why Your Life Sucks (or Doesn’t)” Adam Dachiss has some useful suggestions for measuring stuff in your life. “Why You Should be Tracking Your Habits and How to Do It” by Belle Beth Cooper is also useful. However, all three of those articles are a few years old now and might not be perfectly applicable.

Whatever method you use, the key activity is to decide what you are going to pay attention to and then to create a system that is manageable for your life for the span of a week wherein you will quantify information about your self or your behavior.

For example, one step of this process might be to decide to measure how happy you are and to create a spreadsheet with a column for “Happy.” Then when you wake up in the morning, while you’re waiting for the coffee to brew, you’ll pull up the spreadsheet and enter a number between 1 and 10 indicating how happy you feel. You will continue adding rows at some set interval (every hour maybe). You will probably have some columns that are a little less subjective than “how happy do I feel right now?” (like “how many times did I talk in class today?” or “how much time did I spend studying?” “how many minutes have I spent looking at my phone in the last hour?”). You can decide how objective or subjective your categories are, but recognize that those decisions will impact the sorts of conclusions you draw from this process.

For now, you just need to decide what you will track and then to be as meticulous and careful as you can be about actually tracking this information either directly into a spreadsheet or in a format that can easily be transferred into a spreadsheet at the end of the week.

I will follow up with more information about visualizing that data once you’ve collected it, but don’t worry too much about that yet. Just collect data and pay attention to any patterns you notice while you do so.

Visualizing that data

Now that you have gathered your data, it’s time to analyze it further and visualize it.

With the data set that you’ve gathered, which is just for a week or so and only with a handful of variables, you probably won’t need a computer or special tools to analyze it. However, you might find loading your data into a spreadsheet (like in Excel) if you haven’t already been keeping it in that format will help you a lot to analyze it and see patterns in the data.

Because this is an assignment about collecting data about your own life, there is room for you to decide how “scientific” you want to be with your project. Even if you have never used spreadsheets for much of anything, try to quantify your data as much as you can and make an effort to be detailed and accurate with your information, but that said the types of data you chose to collect and the category you’ve decided to study will have a huge impact on the type of analysis you undertake. It is okay for you to have some more subjective categories and it’s okay if your final analysis or visualization is somewhat subjective too.

Tools

There are numerous methods you can use to create your visualization — anything from paper and crayons/markers/pencils to sophisticated data visualization software like Tableau. MS Excel also has some pretty sophisticated charts that you can create from your data. And there are also lots of free online tools that you can use too — it’s admittedly been a year or more since I really surveyed the set of free tools available, but I’d probably still recommend Infogram if you want a free web-based infographic maker and aren’t sure where to start.

For help deciding what type of chart or graph might be most effective in visualizing your data, consult the Data Viz Catalogue (it might be most helpful for you to switch to the “sort by functions” view at the top of the page).

Digital Images

Hand-drawn charts and graphs are perfectly 100% acceptable, if that’s what you prefer. However, please do not spend lots of time carefully crafting hand-drawn charts and then snap a crappy picture of them on your cell phone to post to the web. There are lots of scanners available on campus that you can use to scan your chart into a high-quality JPG image — I’d suggest that you take a quick trip to the Media Lab on the 4th floor of the library and scan your drawings. That space is underutilized and an excellent resource that you should know about.

If you create your visualizations with an online tool, just make sure that you can export them as a JPG image, or that you can at least take a good screenshot of your work.

Publish

Publish your charts as a sketch post to your site. Identify what conceptual issue you were tracking or what question you wanted to answer (or begin to answer). Include 2 or 3 paragraphs explaining what conclusions you have drawn from the data that you collected. Were you able to answer the question you had posed for yourself? What sorts of judgement calls did you face while gathering the data? Why did you choose to visualize your data in the manner that you did? What do these visualizations say about your own life? If you were to continue this project into the future, would you go about it in pretty much the way you have done this week or would you do things differently now that you have looked at the data to this point? Have you found this to be a valuable tool for self analysis?

Comic book

Creating this comic book felt like the first time in my adult years that I am proud of a drawing oriented work that I have done. It took me a long time to learn how to use the Wacom (which is a tool for drawing in photoshop) but after getting the hang of it, I became comfortable in being able to draw this comic book. I knew it would take a lot of time that I necessarily didn’t have to put into. But I truly wanted to turn in work that I was proud of and wouldn’t be ashamed. My comic book is sorta about the struggle o being dyslexic and not being able to succeed when you put a lot of effort into the readings and this assignment truly felt like something that if I put the effort into it, that I would truly be able to get something good out of it. This is probably the single most favorite assignment I’ve had in college, and probably remain at the top until I graduate.

My comic book

Combophoto

Screen Shot 2018-04-02 at 11.29.50 PM

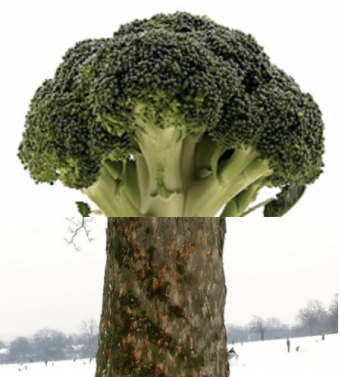
Scrolling through Mcmennamy’s pictures, I was drawn to the majority of the pictures that included food.  I recently started a foodstagram (instagram that showcases my pictures of food) and started thinking of how I could incorporate some of these s=combo photos into my feed.  I’ve been eating a lot of broccoli lately because I don’t eat bread during passover and I find that broccoli is quite filling. So I searched broccoli and started thinking of what broccoli resembles. That’s when I thought of a tree trunk.  I also like how the bottom picture of the trunk takes place in the winter time while the top picture of the broccoli is bright green as if it’s spring or summertime.  A challenge I had putting these two images together was the sizing and lining them up so the image appeared as more cohesive and fluid.  This final image conveys the life of a tree in different seasons and a vegetable branching off and finding new roots.

SKETCH 8: COMBOPHOTO

I could not decide what I want to use for this sketch assignment. However, when I decided to take a break and to open Facebook to see some new posts and relax a little bit, I saw a picture with this smile at the bottom. It reminded me of tomato because of its color and shape, so I thought it might be interesting to combine them and see what happens. I used PicsArt to create this photo. In my opinion, the result looks unusual, funny, and well balanced. Overall, I like the combination of these two images.

1522728122746

Photocombo

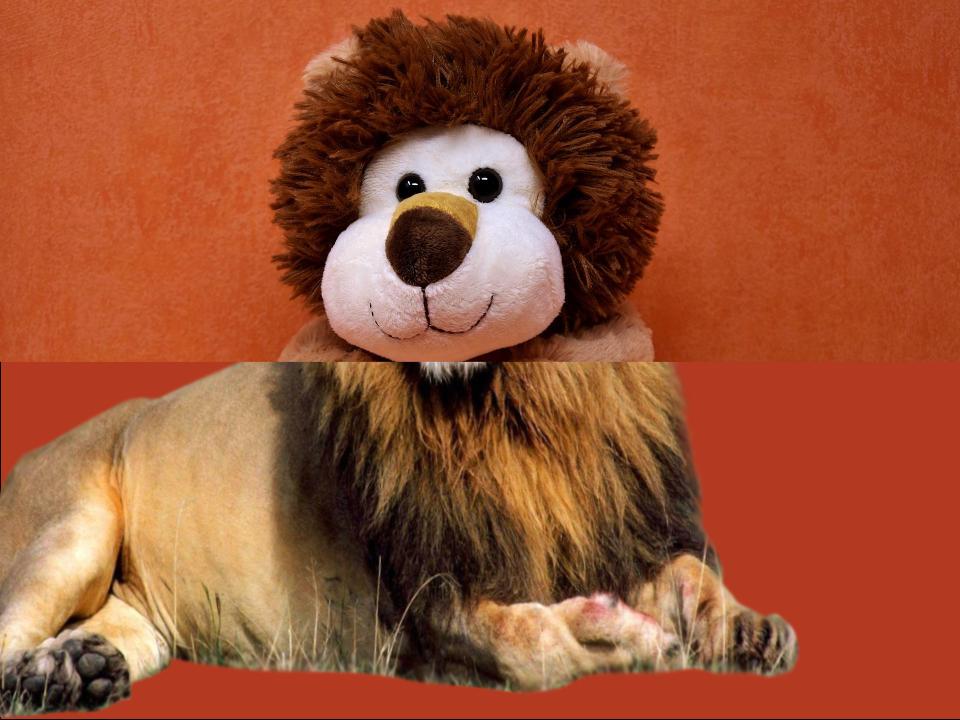
Creating my photocombo was relatively simple. As soon as I saw the assignment I began brainstorming ideas, looking for things around me to inspire me. I saw my friends stuffed animal in his room and the rest was easy. Finding the right pictures was a bit of a challenge but after a short amount of searching I found what I needed. I tried editing the photos together in Flickr but couldn’t figure out how to do it so I decided to do on google-drawings. It was pretty easy to align the two with a little fiddling. I really enjoyed the project because of its simplicity and its creativity.Combophoto

Literacy Narrative Comic

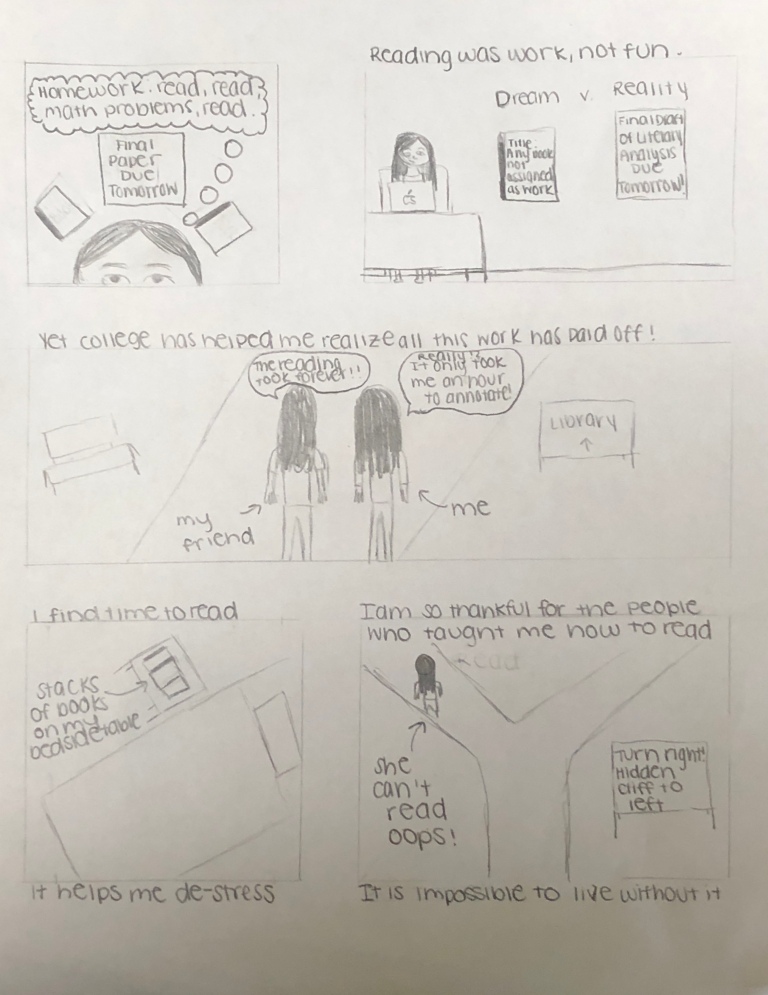
I really had a lot of fun drawing and editing my comic. The projects I complete normally rarely have to do with myself and my own personal experiences so it was very refreshing to analyze my own piece of text and create my own expression of the work as both the author and reader. I took the time to read the feedback from my peers after I completed a (very) rough draft of this comic and I feel as though I truly captured the light-hearted emotion that I intended in both pieces. I added more detail and completed thoughts that may not have been explicitly written. The comic, although focuses heavily on the images, relies on a lot of the text to truly shape the story. Leaving out color was an artistic choice that I made in order for the reader to not be as distracted.

IMG_1417

IMG_1419

IMG_1421

1 10 11 12 13 14 44