Comparing Palestine and Pyongyang reflection
Image credit: “Mirror” by flikr user Shapour Bahrami
ENG101.02. Spring 2018. Emory University
Image credit: “Mirror” by flikr user Shapour Bahrami
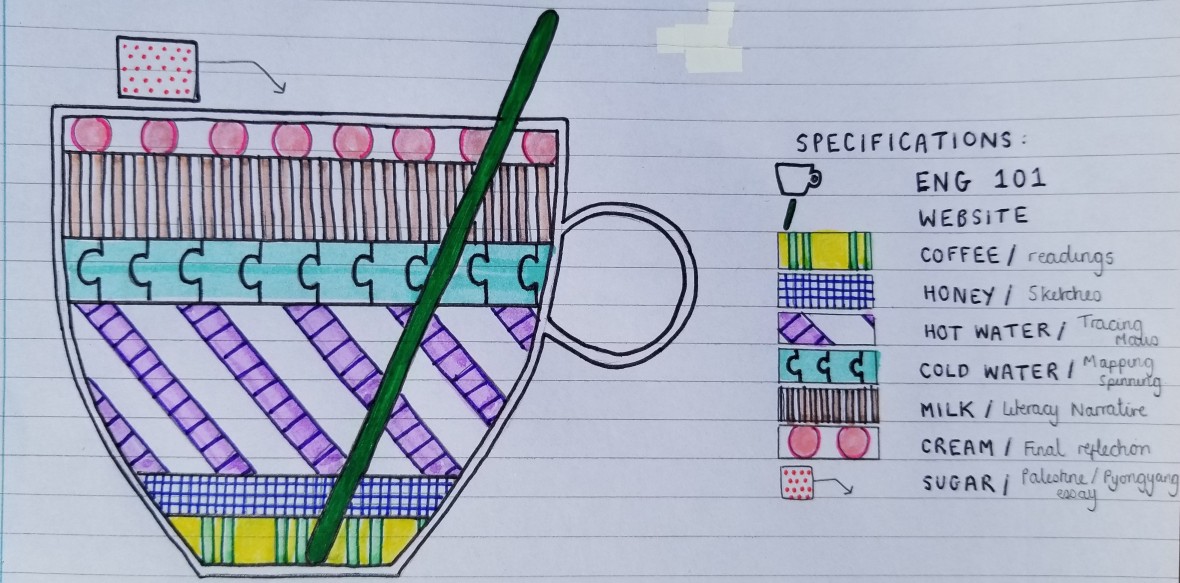
For my sketch assembly, I chose to represent the work I’ve completed this semester as a cup of coffee. Part of this is just because coffee is an easy drink to break up into parts, but I could also say that coffee is something that I hated and would never drink before the semester began, but I started to drink it much more frequently as the semester went on, and I actually don’t mind it now. This is similar to my relationship with English classes. I had never really enjoyed an English class before this year, but now that I have tried lots of different forms of writing, I have found some types that I actually quite like.
Within the coffee cup (which represents this English course as a whole), I have the instant coffee that you put in right at the bottom. The coffee granules are supposed to represent the readings that we completed over the semester. Not only does this include the main books that we read, but also our textbook readings from the beginning of the course. All of our readings formed the course foundations, as we based a lot of our other work off these. Next I put in honey, which is supposed to represent the sketches that we did in class, and every Sunday. The sketches were some of my favourite parts of this semester, and honey adds a nice sweet element to the cup of coffee. After this comes the hot water, or Tracing Maus. This was quite a big assignment and so makes up a large amount of the cup. It also brought together a lot of the other elements (it included drawing, reading, and written analysis), and so was a fundamental part of the course. I then added cold water which represents Mapping Spinning. Sometimes you need to add cold water so that you can drink the coffee straight away without it burning your mouth. In a similar way, Mapping Spinning was some light relief for me near the end of the semester as I could do a more mathsy based, rater than written based assignment, and enjoy it more. On top of the water, we have milk (and my Literacy Narrative). I would say that the Literacy Narrative was the second biggest project this semester, and it was also a really important part of the course for me, as I was able to discover a new, visual approach to writing, which I had never tried before. Just like milk is crucial to a cup of coffee, the literacy narrative was so important in my writing this semester. The last section in the cup is cream, which represents the final reflection. Cream is a nice last edition and really brings the whole cup together, just as the reflection will do. I have also included a stirrer in the cup, which represents my English website. Posting everything online was a huge part of this course, and is integrated into every project that we did. The last element of this diagram is the sugar cube outside the cup. This is supposed to represent the Palestine/Pyongyang Comparison essay. I don’t usually put sugar in my coffee, because I already have the honey to sweeten it, but some people really like sugar (just like some people really like writing essays – but not me). It is still a part of the English course, but it was my least favourite, so it is outside of the main cup.
I enjoyed this sketch assignment, and I think that approaching the final letter will be easier for me now that I have already completed this sketch and thought about all of my work this semester. I also really liked the combination of a mathematical and artistic sketch – these are two areas that I really enjoy working in.
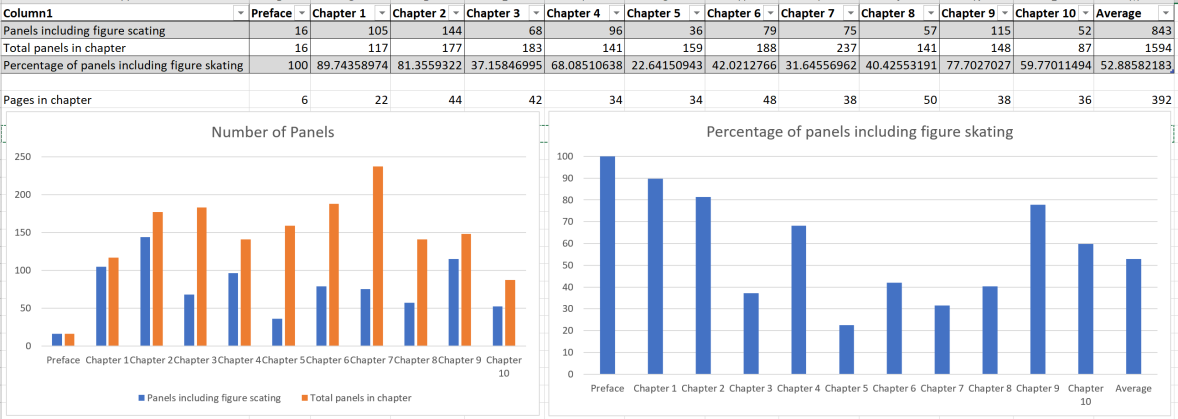
For this project I had to draft a “model” or a “map” that highlights spatial, temporal, thematic, or structural elements of Tillie Walden’s Spinning. I chose to assess just how much figure skating appears in Spinning and so I counted the number of panels in each chapter that were about figure skating, and then calculate what percentage this was of all of the panels in the chapters.
Although I think that my map is relatively accurate and clearly represented, I also think that it may be limited due to my subjective opinion on whether a panel is about figure skating or not. For example, in some panels, Tillie is with her figure skating friends at a competition, but they are talking about whether Jacob or Edward from Twilight are more attractive. In these instances, it is hard to decide whether that panel is about figure skating or not. Throughout the chapters, there are several panels that could be considered to be partly about figure skating and partly about something else. In these cases, I counted half panels. I also tried to keep the same categorizing system so that I was consistent throughout, but some people may get slightly different numbers and percentages than I did, due to its subjective nature.
I have never had to quantify a book in this way before, but it was a new and interesting way of analyzing a text, and I enjoy working with numbers, so I would definitely try something similar to this again.
Image credit: “Spinning” by Flikr user Robert Nunnally
 We have discussed many times in class how Tillie Walden’s graphic novel “Spinning” cannot be described as being “about figure skating.” “Spinning” is more of a coming of age story of an adolescent trying to find herself as she is growing older and realizing she is unlike those around her. Though she is writing about her true scenario where she practically grew up on the ice skating rink, the story uses figure skating as more of a metaphor for how Tillie is going through her life.
if you feel it helpful, a short bit of explanatory text. Then write a reflective post in which you link to the map and address the following questions:
For my data visualization, I tried to track how healthy I was on a normal day. Although health is comprised of many many different factors, I chose 5 categories that would be relatively easy to measure:
From the data I have collected, I can conclude that my everyday healthiness varies A LOT! Sleep plays a large factor, and it is easy to see that college has well and truly messed up my sleep schedule. Some other interesting conclusions are that on some days I spend very little time outside. This was surprising to me because I have always enjoyed the outdoors and just spending time in the sun, but on days when I have a lot of work, or I nap in the middle of the day, I spend a lot of time indoors. I also hug a lot, but it doesn’t appear to be that significant because of the scale I used on this category compared to the rest of the data.
In general, I think I was partially able to answer the question that I had posed for myself. Although my investigation wasn’t entirely all-encompassing, it gave me a rough idea and allowed me to realize some important things about my everyday life.
While gathering the data, I had to make several judgement calls about the scale of each data set collected. For example, I rated my happiness / 100 instead of /10 so that it was visible on the chart, I also rounded the number of hugs and minutes outside to the nearest 5 hugs/ 5minutes so that I had easier numbers to work with.
If I were to do this project again in the future, I would go about it in a similar way. If there was a tool that I could use to more accurately measure how long I spend outside, or how many hugs I gave, my data may be marginally more accurate, but in general, I think that I was able to collect my data with a reasonable standard of accuracy. I may also change the scales that I use, so that the number of hugs I give in a day features more prominently amongst the other data.
I chose a stacked bar chart to present my data because I think it gives the clearest representation. All of the individual pieces of data give a cumulative representation of my health on that day, and the bar graph certainly represents this clearly.
I have found this to be a pretty good tool of self analysis because it made it me realize new things about myself. However, in order to get a more comprehensive view of my health, I would record more data that is involved with health, such as calories eaten, sneezes, coughs, etc or number of breakdowns a day. Overall, I am pleased with this project.

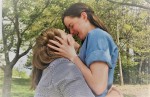
For this assignment, I wanted to recreate a movie scene that most people would recognize. I could’ve asked more of my friends to get involved in this project, but sometimes too many people just makes things too complicated, so I tried to think of a relatively simple scene that could be recreated with just me and Katherine. I could’ve made the photos more similar but finding a more blue background, with Katherine wearing a white shirt which was damp, but other than that, I think its a pretty good recreation – if only we could’ve kept straight faces.

I came up with this idea as I was eating a cupcake from the infamous DUC-ling. I had our ComboPhoto task in the back of my mind, and I just thought that it would be interesting to replace the icing with other images, and see how it turned out. My next task was to think of white objects that could possibly look like icing. As demonstrated by my 5 ComboPhotos, I had plenty of ideas. The main challenges that I faced with this task were removing the backgrounds from the original photos, and cropping/ resizing the images so that they fitted together. My favourite creation is the cupcake with cotton balls as icing, I think the images just fit together well. I’m not too sure what the final image conveys, it is just fun to look at.

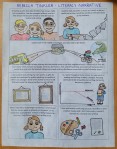
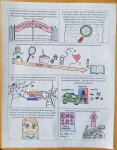
The hardest part of this assignment for me was deciding on a story to turn into a comic – I had some fun experiences over spring break, but nothing really seemed worth of turning into a comic! I still don’t know if its the ‘right’ story, but it is true, and I find it entertaining. I found it quite easy to turn this story into a comic once I had come up with the idea. I had already had a lot of practice from my Literacy Narrative comic, and so I followed the same process for this one, where I drafted it online, where its easy to edit, and then printed out the boxes and drew in the illustrations. On the spectrum of truth, I think this comic falls closer to Spiegelman. The layout is more traditional in terms of comics, and there isn’t much personal bias. I think it is a story that lots of people can relate to, and the simple illustrations mean that it is easy for readers to imagine themselves in my place.


The general feedback that I received for my comic draft was that it was well on its way to being finished, with illustrations that made it easy to read. Fidan, Isaac and Filip also all agreed that my comic included lots of changes in angle, distance, and centering which made it interesting and appealing, however, I still feel like I would like to add a bit more variation in panel shape/ size if possible. Another suggestion that I received was to add a frame or say more about exactly where I am from. It would be possible to combine these two changes, and add a small circular frame within the third panel which adds more detail about where I am from, and also adds some more panel variation. Some other improvements that I would like to make to my literacy narrative comic are: to finish the illustrations, add colour, and integrate some of my narrative into the images. I would also like to come up with some better narrative in my final frame which brings my comic to a clean end.