Sketch 10: Data Visualization From Everyday Life
Throughout this project, I was concerned that the act of consciously collecting data would actually alter the outcome of the data. The fact that I knew I was recording my actions would probably lead me to increase or decrease that behavior based upon my preconceived notions of whether that activity was positive or negative. Instead, I looked for data that had already essentially been collected and logged. This led me down a little bit of a rabbit hole where I became more mindful not only of the abundance of data that I create, but the amount that companies like Google and Facebook are able to take advantage of that data. I decided to focus on my browser history since I utilize the internet almost constantly. I also believe in being somewhat unbiased with my hypothesis when first starting out with research. I didn’t want initial interests blocking me from finding something intriguing that I wouldn’t have expected. In the course of my searching for a program that could go through my internet history and collect some numbers, I found a browser extension called Web Historian.
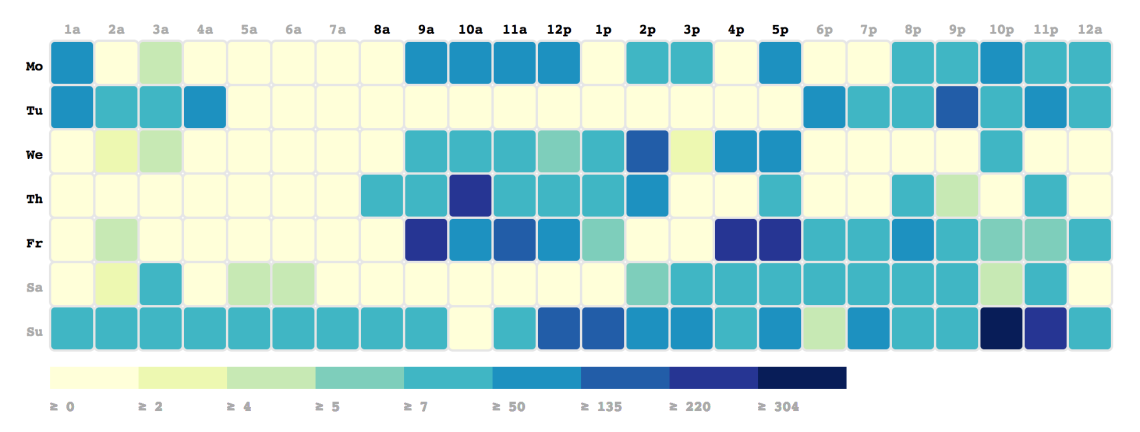
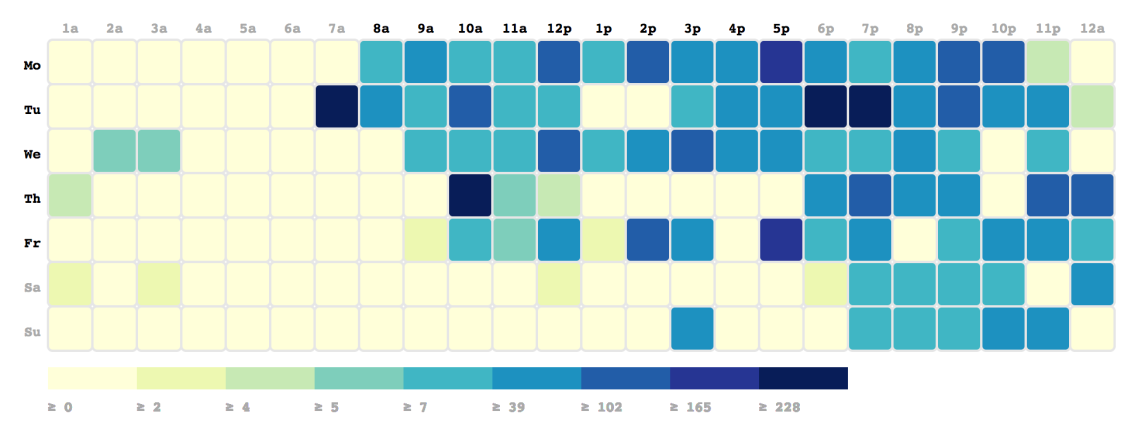
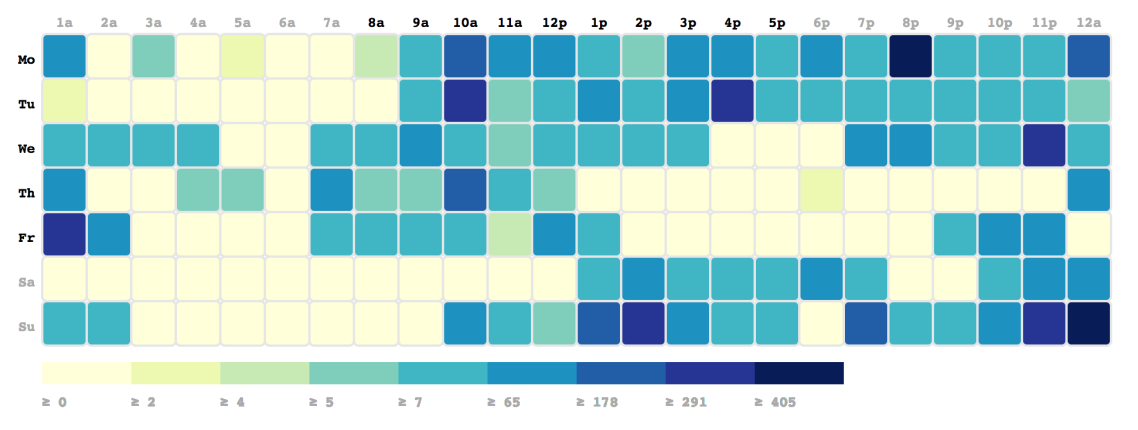
These are some heat maps describing my clicking activity versus dates and times.
April 2-8
April 9-15
April 16-23
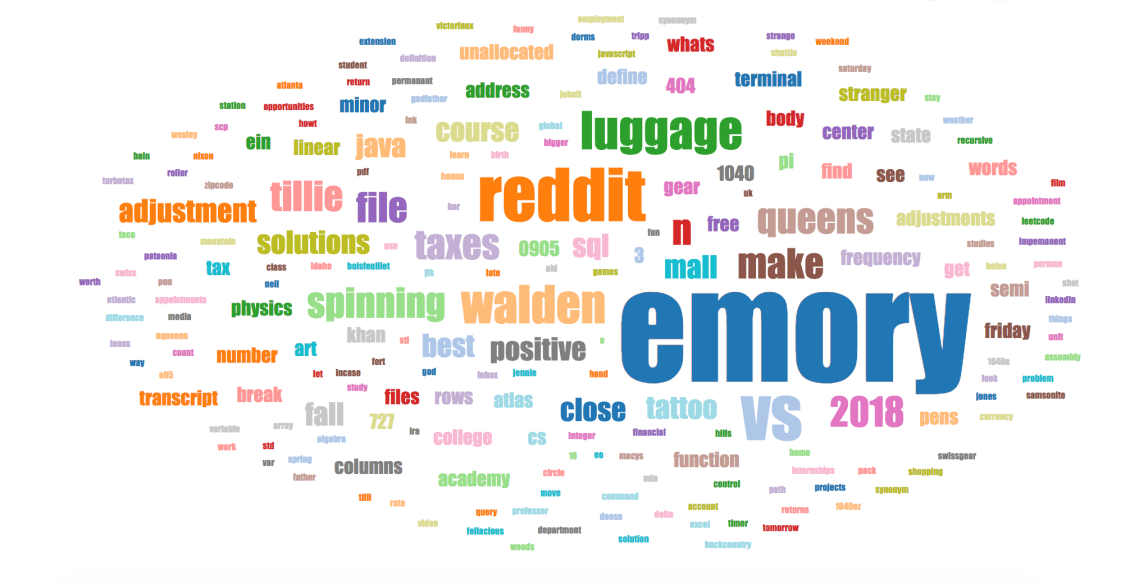
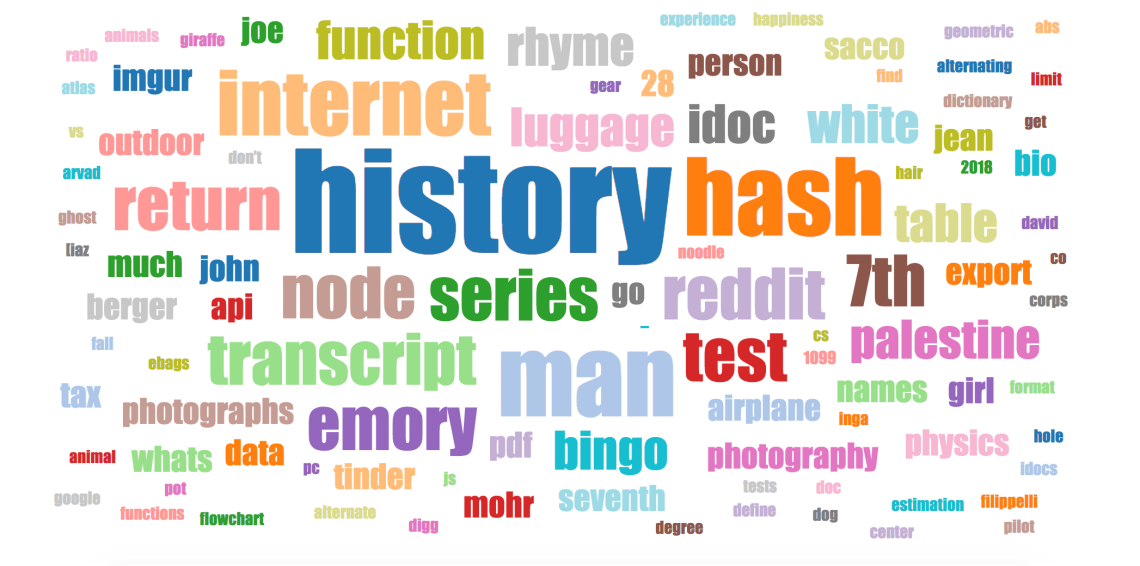
These are some word clouds constructed from my unique search terms.
April 2-8
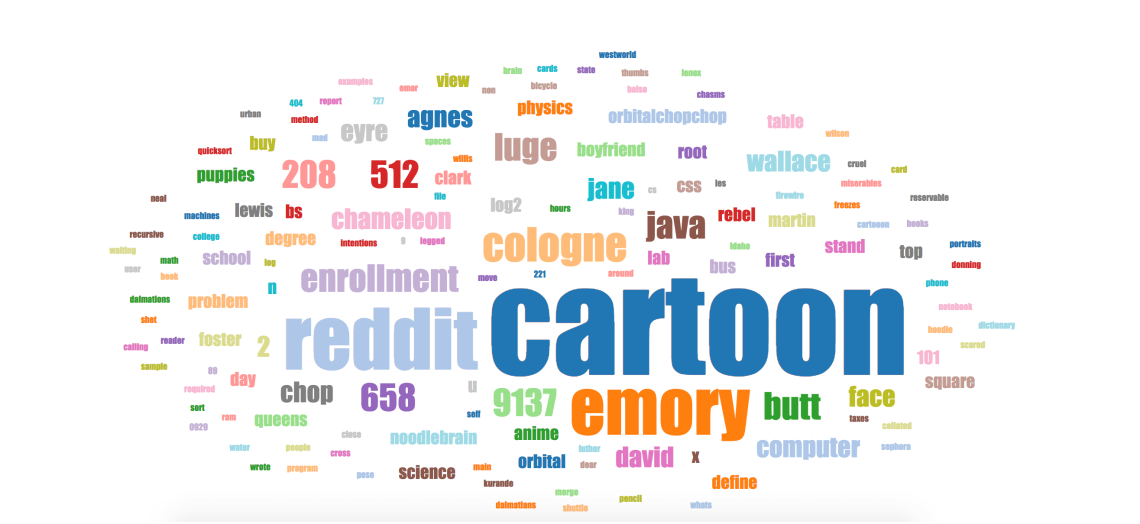
April 9-15
April 16-23
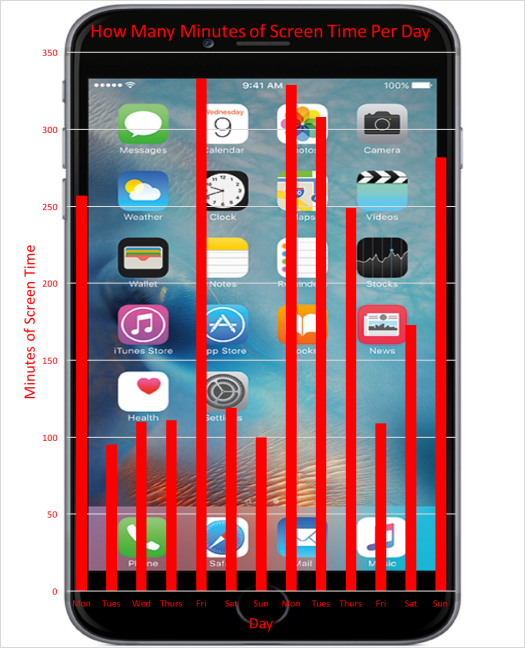
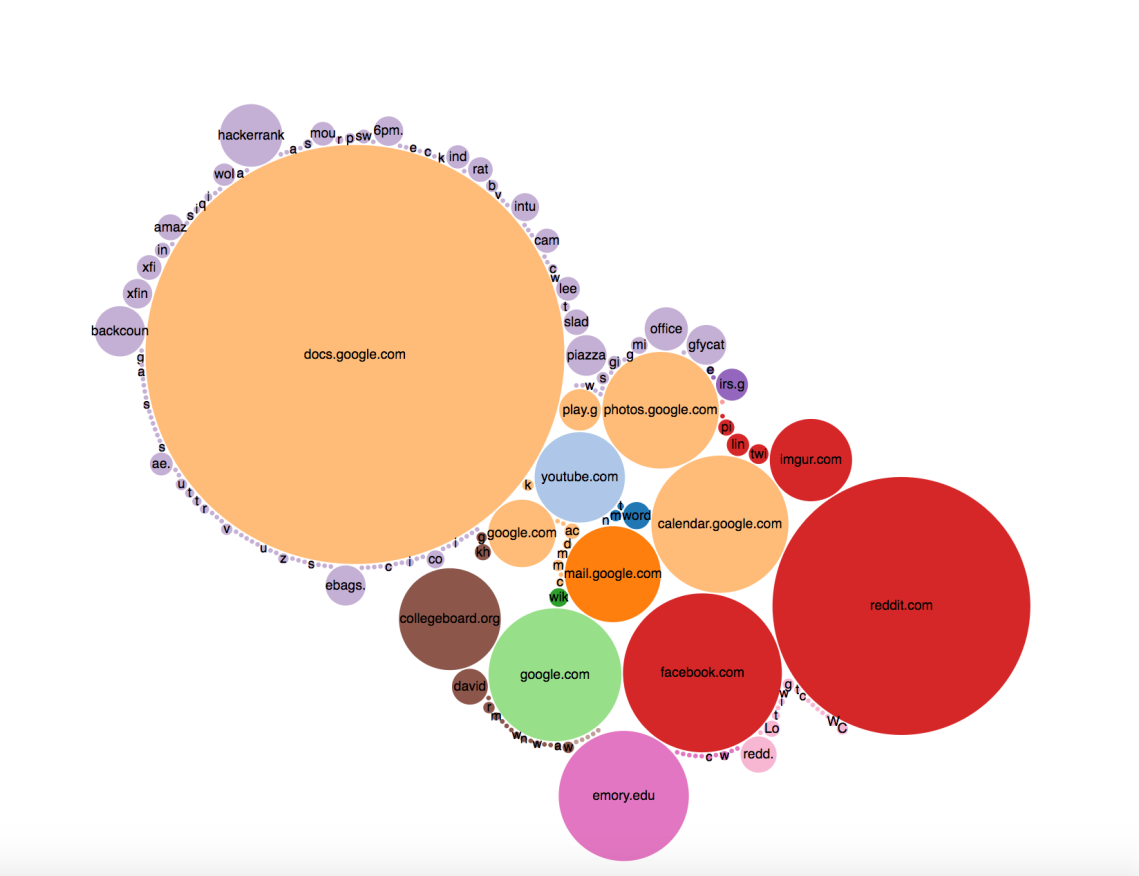
This graph describes the amount of time I spend on certain webpages.
April 3-23
As a result of seeing this data, I am most concerned about the times of day I am using the internet. Most of the heat maps show that I was active online in the late evening to early morning. I know that looking at a screen will make it harder for me to fall asleep. An erratic sleeping schedule has also been linked to numerous health issues. I will probably look into another browser extension that limits the websites I can visit during a set window (when I should probably be sleeping). I will probably be looking into other ways to monitor the data I am sending out into the internet in the hopes of being more cautious about companies monitoring my information.
In the future, it will become exponentially easier to track almost every data point you could ever want about your life due to better technology. There is something paradoxical about using technology, something that is definitely not human, to gain a closer understanding of humans / ourselves. I have been thinking about these things more so than I would usually due to this project. Another question I have been thinking about is how technology has affected our lives. I cannot really be a subject for this because I realize I have never really existed in an age where knowledge and computing power have been scarce.
Link to Sketch 10: Data Visualization From Everyday Life Assignment