Sketch 11: Assemblies

Due: 4/29

Tag: sk11

For some unknown reason, the National Archives includes a document entitled Cocktail Construction Chart, which was created by the US Forest Service in 1974, showing recipes for a group of cocktails represented in the style of an architectural diagram.

For this week’s sketch, think about the work you’ve completed in this class and your own learning and thinking processes — then break all that down into component parts, represented in some sort of an architectural diagram like this one. I’m less interested in the quality of the drawing itself and more in your analytical ability to break down something complicated into a series of steps and to represent that as if in such a diagram.

Sketch 10: Data Visualization from Everyday Life

Due: 4/22

Tag: sk10

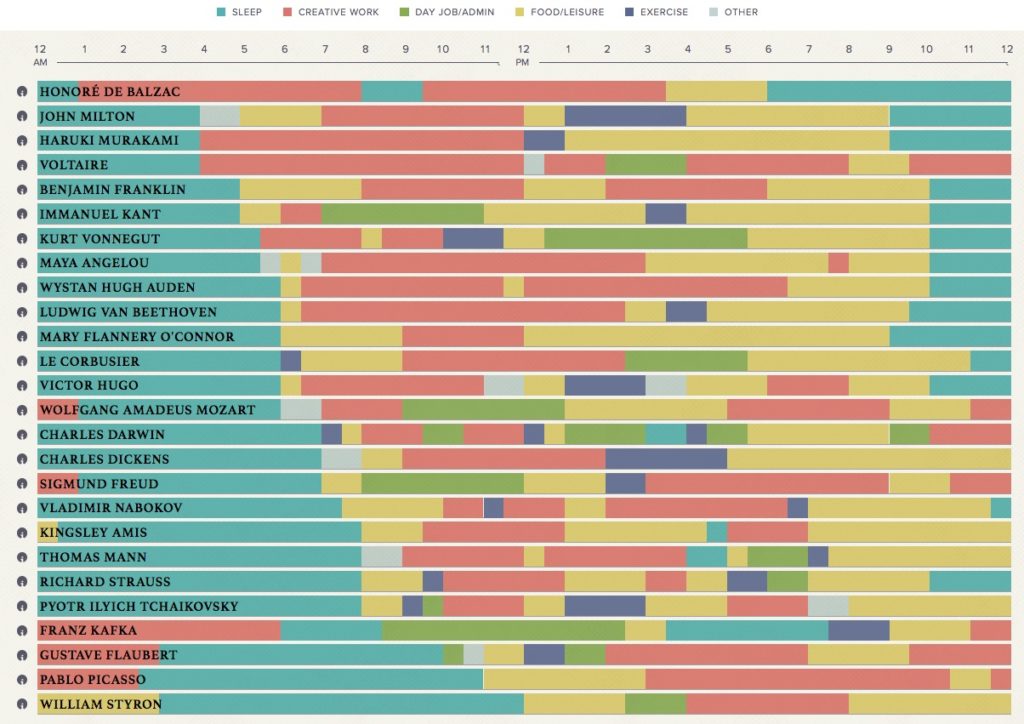
When Mason Currey wanted to understand how he could manage to produce more creative work despite the challenges of everyday life, he set about studying how a bunch of other famous creative people organized their daily lives and what routines they established for their own creative work with the assumption that there were valuable lessons there. Daily Rituals was the result of that research — and then a number of different people and organizations have set out to visualize the insights of that book so that we can see larger patterns in the midst of all this biographical information. Podio’s graphic, which is the feature image on this post, is one of those (check out their site for the interactive version)

For this sketch assignment, you will choose one concept in your life that you want to analyze, something that is not already easily and obviously measured, or doesn’t vary within the span of a day or a week (good categories: awesomeness, mindfulness, healthiness, creativity, productivity, and similar … bad categories: number of steps, hours of sleep, caloric intake, how good is my eyesight?). Decide on a set of about 5 categories that you can use to measure that concept in your life and track those categories for a week or more, then you will produce a visualization of the data that you have gathered and use that visualization to help you understand something about your own life that might not be obvious from your own day to day activities.

Tracking Data

If you’re looking for suggestions about what to track, browsing the “quantified self” tag at Lifehacker might be worthwhile.

Once you’ve got categories, create a spreadsheet where you can track those categories throughout the day. Either take notes in a journal or on your phone and enter the results into your spreadsheet at set intervals, or make the spreadsheet in Google Drive and access it from your phone, or use the site Trackthisforme, or install a tracker app on your mobile device (I found some by searching for “quantified self” apps).

In “How to Track Everything in Your Life Without Going Crazy” and “Fill Out This One-Minute Form Every Day and Find Out Why Your Life Sucks (or Doesn’t)” Adam Dachiss has some useful suggestions for measuring stuff in your life. “Why You Should be Tracking Your Habits and How to Do It” by Belle Beth Cooper is also useful. However, all three of those articles are a few years old now and might not be perfectly applicable.

Whatever method you use, the key activity is to decide what you are going to pay attention to and then to create a system that is manageable for your life for the span of a week wherein you will quantify information about your self or your behavior.

For example, one step of this process might be to decide to measure how happy you are and to create a spreadsheet with a column for “Happy.” Then when you wake up in the morning, while you’re waiting for the coffee to brew, you’ll pull up the spreadsheet and enter a number between 1 and 10 indicating how happy you feel. You will continue adding rows at some set interval (every hour maybe). You will probably have some columns that are a little less subjective than “how happy do I feel right now?” (like “how many times did I talk in class today?” or “how much time did I spend studying?” “how many minutes have I spent looking at my phone in the last hour?”). You can decide how objective or subjective your categories are, but recognize that those decisions will impact the sorts of conclusions you draw from this process.

For now, you just need to decide what you will track and then to be as meticulous and careful as you can be about actually tracking this information either directly into a spreadsheet or in a format that can easily be transferred into a spreadsheet at the end of the week.

I will follow up with more information about visualizing that data once you’ve collected it, but don’t worry too much about that yet. Just collect data and pay attention to any patterns you notice while you do so.

Visualizing that data

Now that you have gathered your data, it’s time to analyze it further and visualize it.

With the data set that you’ve gathered, which is just for a week or so and only with a handful of variables, you probably won’t need a computer or special tools to analyze it. However, you might find loading your data into a spreadsheet (like in Excel) if you haven’t already been keeping it in that format will help you a lot to analyze it and see patterns in the data.

Because this is an assignment about collecting data about your own life, there is room for you to decide how “scientific” you want to be with your project. Even if you have never used spreadsheets for much of anything, try to quantify your data as much as you can and make an effort to be detailed and accurate with your information, but that said the types of data you chose to collect and the category you’ve decided to study will have a huge impact on the type of analysis you undertake. It is okay for you to have some more subjective categories and it’s okay if your final analysis or visualization is somewhat subjective too.

Tools

There are numerous methods you can use to create your visualization — anything from paper and crayons/markers/pencils to sophisticated data visualization software like Tableau. MS Excel also has some pretty sophisticated charts that you can create from your data. And there are also lots of free online tools that you can use too — it’s admittedly been a year or more since I really surveyed the set of free tools available, but I’d probably still recommend Infogram if you want a free web-based infographic maker and aren’t sure where to start.

For help deciding what type of chart or graph might be most effective in visualizing your data, consult the Data Viz Catalogue (it might be most helpful for you to switch to the “sort by functions” view at the top of the page).

Digital Images

Hand-drawn charts and graphs are perfectly 100% acceptable, if that’s what you prefer. However, please do not spend lots of time carefully crafting hand-drawn charts and then snap a crappy picture of them on your cell phone to post to the web. There are lots of scanners available on campus that you can use to scan your chart into a high-quality JPG image — I’d suggest that you take a quick trip to the Media Lab on the 4th floor of the library and scan your drawings. That space is underutilized and an excellent resource that you should know about.

If you create your visualizations with an online tool, just make sure that you can export them as a JPG image, or that you can at least take a good screenshot of your work.

Publish

Publish your charts as a sketch post to your site. Identify what conceptual issue you were tracking or what question you wanted to answer (or begin to answer). Include 2 or 3 paragraphs explaining what conclusions you have drawn from the data that you collected. Were you able to answer the question you had posed for yourself? What sorts of judgement calls did you face while gathering the data? Why did you choose to visualize your data in the manner that you did? What do these visualizations say about your own life? If you were to continue this project into the future, would you go about it in pretty much the way you have done this week or would you do things differently now that you have looked at the data to this point? Have you found this to be a valuable tool for self analysis?

Sketch 9: Recreate a movie scene

Chris Pratt holding raptors at Bay in Jurassic World

Chris Pratt holds the raptors at bay in Jurassic World.

Due: 4/8

Tag: sk9

Choose a single moment from a movie or television episode and recreate that scene as closely as you can in a single photograph. Think about how you can creatively use wardrobe items or props that you already have at your disposal and the landscapes and building spaces available to you in order to create your scene. In fact, you might find that it’s best to begin by thinking about what you might be able to pull off and to work backward from there to choosing a scene.

By definition, you don’t have incredibly powerful movie cameras, cinematographers, a cast and crew, a prop and set design department, and CGI f/x staff for post production; therefore, you are never going to perfectly recreate any scene. However, with a little creativity you can still create a powerful version of a scene even without all that fancy paraphernalia, as in the version of Jurassic World at the top of this post and others seen here.


Poster for Lost in Translation
Albrecht Durer's Self-Portrait of 1500
My recreation of Durer's self-portrait

More than a decade ago, I recreated these scenes above as part of a larger photographic creative project. For my version of Lost in Translation, I rearranged the furniture in my bedroom and borrowed my wife’s bathrobe. I could never quite get the tilt of my head right. For my recreation of Albrecht Dürer’s Self Portrait of 1500, I couldn’t reproduce the proportions because I was required to make all my shots 4×3 landscape photos and my hair wasn’t long enough to quite pull off the portrait. But I bought a black plastic tablecloth for 99 cents for the background and made the sleeve decorations with crayons on paper. I used a fuzzy scarf and an old leather jacket for the clothes. Despite taking numerous shots and studying the painting very, very closely, I could never get my right hand into exactly the correct position.

Sketch 7: Tell a True Story

Due: March 25

Tag: sk7

Over spring break, be on the lookout for a moment that is worth representing in a comic — watch for some sort of small adventure you might take, or a conversation you are part of, or a conversation you hear, and as you come upon them take notes for yourself and maybe make quick little sketches or take photos to capture images for later. Your story does not need to be momentous. You do not need to be able to fully grasp its significance, such as it is. But watch for a story that seems to be a little window into some sort of meaning or that might show something interesting to readers.

Then create a short comic that portrays that moment as truthfully as you can in a way that combines both words and images.

If you’d like, you can make your comic like “Remind Me” from Palestine (41-50) and include many words to only a few images. Or you can make a comic with only a few words. You can use photographs or draw something or create some other sort of visuals. You can tell a funny story or a sad one, or draw on other emotions.

The only two firm requirements are that your comic needs to have words and images and it needs to show something true. With the full understanding that “truth” is a complicated and contested state of being. (Your story does not have to be a true war story; it only needs to be true.)

Once your comic is completed, publish it to your site as a post. Write a brief reflection about your writing process for this post. How did you know when you had found the right story for your comic? How difficult was it to tell a true story in a brief comic? If you think of Spiegelman and Sacco as outlining two poles of some spectrum defining different approaches to telling true stories in comics, where does your comic fall along that spectrum? What were the most important choices you made along the way of creating your comic?

Tracing Maus Reflection

Extension

Remember, I extended the deadline for the Tracing Maus project — you need to have the pages published to your site by Saturday, March 10.

Reflection Prompt

Once you have completed your Tracing Maus project and published the pages to your site, you need to publish a reflection post as well. The post serves to turn the project in when it syndicates to the class site, and is also an opportunity for you to explain your process in the work you just completed.

Your reflection post should link to the landing page for the project and should address the following questions:

  • Before writing your essay, you went through a pretty involved process of tracing and annotating two pages from the book. Briefly explain what that process was like for you — probably this was very different from most other writing you’ve done, so try to explain what was useful about the process for you. What productive thoughts or analysis occurred through the act of tracing and annotating?
  • For this assignment, instead of writing a linear alphanumeric text you created a series of interlinked pages based around patterns you identified while tracing and annotating pages. How did your writing process change to address this assignment? Did you find it useful to write about ideas in chunks like this, instead of in a more traditional thesis-driven linear format?
  • We talking in class about Spiegelman’s reference to the “secret language of comics” as indicating that the writer/illustrator make a whole series of choices in crafting a comic that probably pass by many readers with little or no conscious notice. Do you feel that this assignment helped you to get in on this secret language? Do you understand Maus better after having written this project? What’s the single biggest insight you gained about the book that you gained during the process of tracing, annotating, and analyzing these pages (maybe something you “knew” on some level before you started but that you really get now, or maybe something you hadn’t really noticed until you worked on the project)?

Sketch 6: What’s in your bag?

Due: March 4

Tag: sk6

Find a relatively large empty space. Take your backpack, messenger bag, or whatever sort of bag you carry around with you regularly, empty all the contents out, and arrange them carefully that they represent a visual snapshot of the stuff you tote around with you on a normal day. Then take a clear photo showing your bag and the stuff and upload it to your site.

Note that like the avatar or the literacy narrative, this too is a type of autobiographical composition. If you have something in your bag that is private, embarrassing, or for some other reason you don’t want it in the picture then make the editorial decision not to include it. Or vice versa, if you would like to assume a certain kind of persona then you might consider including items in your catalog that might be less than fully true.

Add some text to your post listing the items represented in your photo, preferably adding in a bit of explanatory and/or funny commentary along the way. This can be a paragraph of text or a list or whatever format seems most appropriate for you. When these sorts of posts are done by publications, like say The Verge or Timbuk2, they are often not so subtle efforts at product placement but for our purposes there is no reason for you to engage in such advertising games.

Along with the photo and your description of the items, include a paragraph reflecting on what it was like to craft a self-portrait through this photograph. How actually representative is this image of you as a person? What sorts of choices did you make in order to create the image? What was challenging about this assignment? Is representing yourself in a catalog of the stuff in your bag a type of writing? Why or why not?

Sketch 5: Triptych — Beginning, Middle, End

Due: 2/25

Tag: sk5

In How to Read Nancy: The Elements of Comics in Three Easy Panels, Paul Karasik and Mark Newgarden carry out an extended discussion of comics through repeated analysis of the single Nancy strip by Ernie Bushmiller from August 8, 1959 (at the top of this post). They explain that “one of the least tangible yet most significant implements in the cartoonist’s toolbox is the varied use of rhythms.[…] One repetition makes a pair. But add another and the repetitions have become a series, the basic building block of all rhythm. A set of three has the smallest number of elements that can establish a pattern (as well as violate it). Three implies more to come” (134).

For this week’s sketch assignment, create your own triptych comic. As you compose your triptych, I most want you to focus on creating a story with a very clear beginning, middle, and end. Your story can be minimalist, impressionistic, comic, dark, weird or whatever you want it to be — but make sure that each panel of the triptych moves that story forward from beginning to middle to end.

You can draw your triptych, or create one using photographs, maybe along similar lines as the webcomic A Softer World, which ran weekly for about twelve years starting in Feb 2003. Emily and Joey published 1248 comics in that time, each consisting of three panels with photographs and words superimposed on them – often it seems to be a single image cropped into three panels, but sometimes it’s three photos taken as a series – and then the title of the comic appears when you hover your mouse over the comic (creating space for a sort of fourth panel or commentary). The comics tend to be quite dark.

I’m looking for compact and playful storytelling through both images and words. It’s an opportunity for you to play with irony, humor, and/or wit.

Add a paragraph reflecting on your triptych comic. What choices did you make in crafting your narrative? Describe the composition process a little bit. What was challenging about this assignment? How is crafting this sort of comic strip different or similar to other writing you’ve done this semester?

Quick in class writing

Choose the single most important panel from today’s chapter of Maus. Then write a brief paragraph about that panel:

  • In about one sentence describe the panel (size, shape, what’s in it, etc)
  • Very, very briefly describe what’s happening in the panel and how it fits into the narrative of the chapter.
  • Then write a few sentences in which you explain what about this panel makes it so important for you.

Sketch 8: Combophoto

Due: 4/1

Tag: sk8

Stephen Mcmennamy is an Atlanta artist and Creative Director at BBDO. He first came to my attention when I saw his series of “combophotos” that splice together two different images to form a surreal new creation.

Here are a few examples from him:


milk + rope

turf + cake

squash + paint

Take a few moments to look through the images he’s posted on his site linked above or on his Tumblr or his Instagram. Then create your own square combophoto and publish it to your site. You can take your own photos, but probably you’ll want to use images you find on Flickr — make sure you give credit to the originals that you modify to create your combophoto.

The level of technical aptitude for this assignment is actually relatively small, just simple cropping and resizing. The greater part of the challenge is finding images that you can work with. That said, note that Mcmennamy comes up with ideas and then specifically stages photos to combine, and he seems to often spend significant amounts of time shooting and selecting his images. You won’t have lots of time or expensive photo equipment to work with, so I don’t necessarily expect your final images to be as polished and perfectly aligned as his are. More important is for you to be playful and come up with images that combine to create something funny or witty or striking.

To edit the two photos together, you can use whatever photo editing software you’d like. Pixlr is a good free web app, as is PicMonkey. Adobe Photoshop is also available for you to use on the computers in the Media Library on the 4th floor of the Woodruff Library.

Once you have your image, publish it in a post on your class site. Write a paragraph about how you went about choosing the two images you combined and why. What challenges did you face as you created your combophoto? What do you think your final image conveys?

Sketch 4: Human Document

Screenshot of Google image search results for "tom phillips human document"

Due: 2/18

Tag: sk4

The British artist Tom Phillips is probably best known for a project that he began in 1966 and which he has continued ever since–he set himself the challenge to buy the first book he could find at a secondhand bookstore for threepence and to alter every page using drawing, painting, collage, and cut-up techniques to create an entirely new version.

First page of the 1970 edition of Humument.

First page of the 1970 edition of Humument.

He found W.H. Mallock’s A Human Document and combined the words in the title to create A Humument. Phillips not only created new art works from each of the 367 pages but has now completed five different editions of this altered book.

You can view pretty much the complete series of pages on Tom Phillips site here. You can choose pages, view the original and then view different versions of that page.

For this week’s assignment, I want you to create your own visual poem-thing. You can find your own page to alter if you’d like, but I’ll bring in an old used book that you can take pages from too. Think of it as sort of a collaboration between yourself and the book’s original author or think of it as a game where you get to create new text but within the strict confines of the text available on the page.

Obviously, Tom Phillips has been doing this for almost 50 years and I’m not expecting you to produce work that is as polished or complex as his–nor that is necessarily as visually compelling. And it will probably feel very strange to you as you begin, but just let yourself be playful and experiment with your task. You do not need to be a professional artist to make these pages, but you probably do need to be able to relax your desire to be in control of what you produce and you probably need to turn off the self-critical voice that will tell you that you’re doing it wrong.

Alter your page using whatever methods or tools you prefer, then scan the page in color at a high resolution as a JPG or PNG file and load it to your site. You might include in your post the text of your altered page.

1 2