Assemblies

Screen Shot 2018-04-29 at 12.57.18 PM

Everyone remembers story plots from elementary school. Most often shaped like mountains, these charts show the normal progression of a fiction story. The first part is the exposition where characters and plot are introduced. In the rising action, the plot thickens and this is normally one of the longer pieces to the story. It culminates with the climax, where the action, most often a conflict is addressed at its peak. Finally, the falling action wraps up the story while the short resolution does exactly what it says, it resolves, and in children’s books, this could be the “happily ever after.” I decided to make a story plot of my growth in English 101. I started off with skills that I was more familiar with, going to where I was not, but finally gaining more confidence to read and write about things I may not be as comfortable with. This course is almost ending but I cannot wait to continue to grow with my skills after this semester.

Background mountain photo from Flickr

Assemblies- Sketch 11

Looking closely at the Cocktail Construction Visualization allowed me to realize how to go about this overwhelming sketch assignment.  At first glance, the different patterns and shapes scattered throughout the page were extremely confusing. but, I then noticed the key that tied together what each drink consisted of.  Making a key and laying out all eleven Sunday Sketches, four graphic novels, and six larger assignments allowed me to visualize common factors for each part of this Visual Literature Freshman English Class.  

Making the key of common themes of this course and deciphering which projects included each category was sort of challenging.  While some are simple such as “creative approach” and “storytelling”, I felt as though they had to be included to show the theme of this class as a whole.  In addition, I used the three course outcomes to frame some other parts. Knowing which projects formed my skill on revision and reframing projects, taught me how to use a new rhetoric technique of visual representational storytelling, and included textual analysis to strengthen my writing skills will be extremely useful for my Reflection Cover Letter.  

Framing this “Assemblies” assignment uncovered a lot of the synthesis of this class as a whole.  A big example of this took place with the “Data Analysis” section of my key. Our last two assignments- Data Visualization in Your Everyday Life and Mapping Spinning- were the two obvious data analysis projects we completed during this semester.  However, looking back at the coursework allowed me to realize that this theme has been consistent. I have interpreted Tracing Maus and Comparing Palestine and Pyongyang to also include this type of skill in more of a textual way instead of visual.  For example, though we close read individual pages of Maus for the assignment, the overall project of making three connections that encompass the novel as a whole track data throughout the entire layered story.  In addition, comparing and contrasting Palestine verse Pyongyang forced me to uncover similar themes consistent throughout the novel and track their relevances in retrospect to each novel.  

The sunday sketches as a whole show the diversity of visual representations.  Many include personal representations of myself in non-traditional ways. Who would have thought a cartoon avatar, photo of what I carry in my backpack from day to day, or “True Story” would mirror a personal narrative.  As a whole, this course has gone beyond boundaries of a traditional english class. IMG_20180426_0002

Mapping Spinning

2018-04-23We have discussed many times in class how Tillie Walden’s graphic novel “Spinning” cannot be described as being “about figure skating.”  “Spinning” is more of a coming of age story of an adolescent trying to find herself as she is growing older and realizing she is unlike those around her.  Though she is writing about her true scenario where she practically grew up on the ice skating rink, the story uses figure skating as more of a metaphor for how Tillie is going through her life.

if you feel it helpful, a short bit of explanatory text. Then write a reflective post in which you link to the map and address the following questions:

  • How do you understand Spinning differently when you see it through the map that you’ve made about it, rather than you did when you were reading the book panel by panel? How does this abstract model of the memoir reveal qualitative or quantitative aspects of the book that would elude a typical close reading?
  • What questions about Spinning led you to focus on the element(s) that you did when you created your map?
  • Why did your “map” take the shape it did?
  • How does your map succeed and what are its limitations?

Mapping Spinning: Yellow Panels

Screen Shot 2018-04-26 at 12.26.08 AM

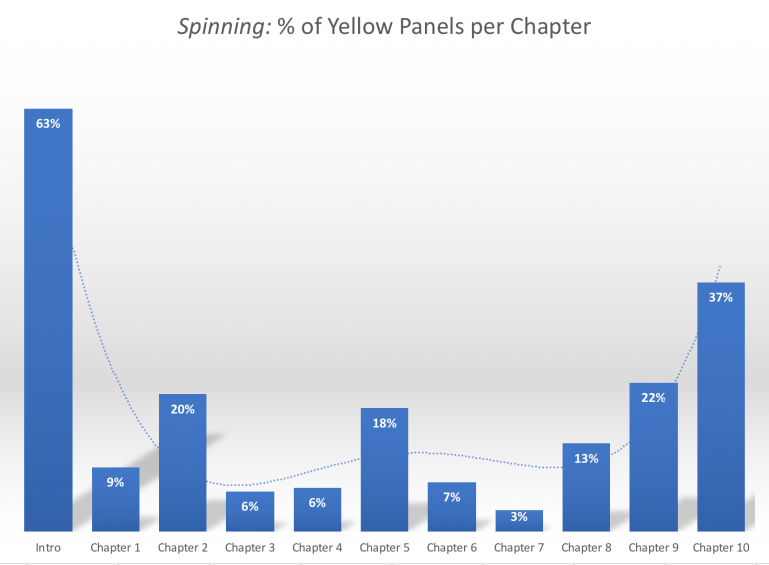
This is my attempt at mapping Spinning. The model above presents the operationalization of “hope”, a recurring theme in the graphic novel which is symbolized by the presence of the color yellow in a panel; here, I present the percentage of panels containing yellow per chapter. A polynomial trend-line indicates a decrease in hope from the introduction, and and a radical increase towards the end of the book.

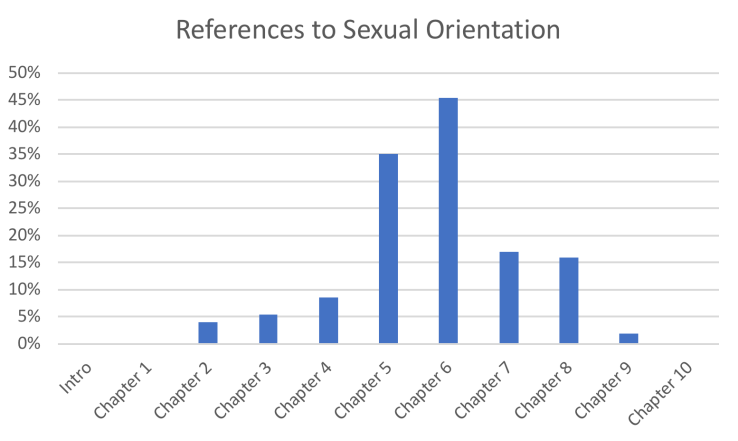
Conducting this numerical analysis reveals that the presence of hope is very high during the introduction –which possesses a joyful tone, almost as if hinting a feel-good novel–, which decreases exponentially throughout the entirety of the book until Chapter 8, where hope settles into the story and Tillie realizes what makes her happy, having its final peak in Chapter 10. In that final span of increasing hopefulness, Tillie quits skating, giving that it made her unhappy, and accepts her homosexuality, recognizing her sexuality does not mean the end of the world. When she learns to accept herself as she is, the numbers and my intuition as well indicate hope exponentially increases.

This helped me understand that Spinning is not necessarily a story centered around hope, but about a young girl trying to understand her sexuality, and ultimately her path towards self acceptance and making the most of life with what she has by dropping anything that pulled her down (ice skating), and living her life as she truly is.

What led me to explore hopefulness in this assignment was the seemingly spontaneous bursts of yellow throughout the entire novel. These led me to believe there had to be some sort of pattern hidden between the amount of yellow present. The model succeeded greatly in measuring the percentage of panels possessing yellow, but falls short when taking into account the amount of yellow per panel.  In multiple panels, very faint hints of yellow can be observed, while some are almost 75%+ yellow.


In conclusion, the operationalization of “hope” led me to understand that as Tillie learned to accept herself as she is and seek happiness in life, rather than submit to societal expectation, hopefulness in the book increases in an exponential fashion.
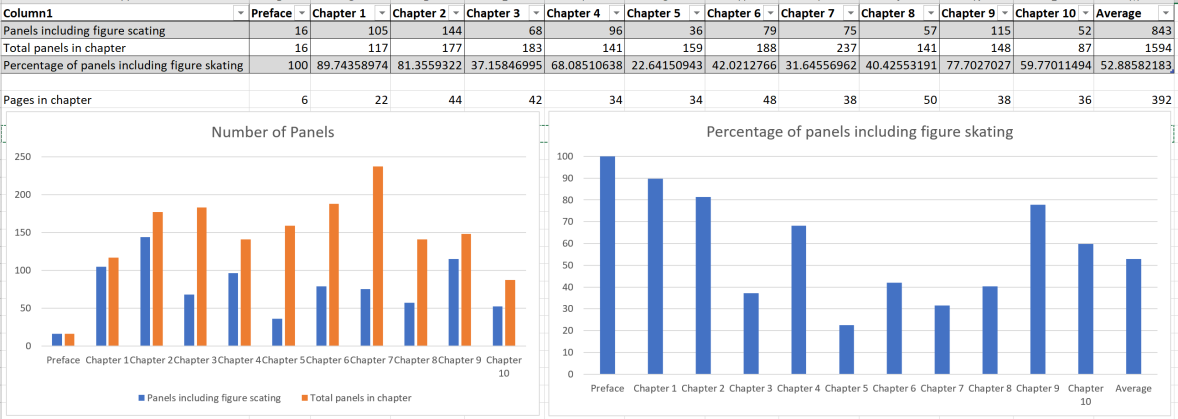
Sexual Orientation in Spinning

One of the standout themes in Spinning was the idea of Tillie struggling with being a lesbian. I also felt that at there was a right balance between focusing on it and then other things. This prompted me to count the number of panels per chapter that reference her sexual orientation.

The main limitation of my graph is that you can’t see a percentage of how much each of the chapters takes up and rather what chapters feature her sexual orientation the most.

Screen Shot 2018-04-25 at 11.54.36 PM

The map took the shape it did because the references to her orientation become more prominent when she is finally outed after her picture with Rae is discovered and she comes out to her parents and friends, and it takes center stage. But once this is revealed it slows down a considerable amount and then fades into the background as her future and her issues become more present.

The map succeeded in showing the ramping and fading of references that I felt when I read, but it came up to my decision of what constituted a reference to her sexual orientation, therefore the numbers may be slightly different if someone else made the same graph.

What this shows me about Spinning is that the themes and moments in the book shift just as Tillie is growing up and therefore we should track exactly where we are and what the story is telling us by what it focuses on.

Mapping Spinning: Reflection

This project. And all the panels. A pain in the butt to count, YES, but a good pain (????). After counting tons of panels and trying to see what I felt, I feel like I understand Spinning as a very different book. Upon initial readings, I thought it was a very sad book. It had a great message, but all I could remember was the hardships and negatives that occurred in the book. But then I looked at it all, and I noticed that there were still panels that displayed positive emotions (hope, happy, etc.). This helped to change Spinning from a book about sadness to a book about life, and it shows that life will have ups and downs, even if you can only see one side.

It was also strange quantifying Spinning. The book felt so emotional that it seemed impossible to “count” anything within Spinning. But it was actually somewhat refreshing to count it all. It helped me understand this book much better all around, as said previously.

To come up with this idea, I simply asked myself what I felt Spinning was emotionally. I’d thought much of Spinning was negative (and a lot of it still was!), but I wasn’t completely sure if it was as one-sided as I remembered. So I was curious enough to judge 1500+ panels on what I emotionally felt in the given moment of reading it.

I think I succeeded in what I wanted to see. Even though it’s quite messy with loads of numbers, I can start to visually see the differences and changes that the book goes through emotionally. However, there are massive limitations to this map. It’s all subjective, which is already very limiting. Furthermore, there are some emotions that are hard to distinguish between each other (annoyance v. frustration) that one has to make tough calls on. But overall, I’m actually quite satisfied.

Mapping Spinning

Each chapter of Spinning opens with an explanation of a different figure skating move and Tillie’s experiences with it. My understanding of this aspect of Spinning was definitely altered when I visualized it through the map I created.  When I was reading Spinning, I simply viewed the chapter headers as a cute and clever way of incorporating each chapter while simultaneously giving the reader insight into Walden’s perspective.  However, when I looked back and focused on the openings of each chapter I began to notice that as the novel progresses, so do the complexities of the figure skating move.  These complexities also carry over into her life experiences and relationships with those around her. Tillie is not only growing up physically, but also handling more and more mentally. That’s why I decided to represent my map the way I did. I filled each chapter number with the move that Tillie assigned it and had the numbers grow in size, similar to Tillie.  I decided to focus on this element of Spinning, because I wanted to see if there was a deeper meaning behind these chapter headers and a connection to the emotions that Tillie was trying to evoke throughout the novel. I think I was very successful in creating my map as it’s easy to follow and conveys the same message Tillie portrays in a new and creative way.

Mapping Spinning Reflection

While reading Spinning, I wanted to especially pay attention to large frames on a page because it means that the author wants the reader to pay attention to it. Since there were so many full page frames towards the end, I wondered if there was a correlation between the progression of the story and the frequency of large frames. Though it is not totally apparent, the amount of pages with large frames per chapter has a positive correlation through the continuation of the chapters.

I believe that the reason for this is because the large frames are used for dramatic effect so as the narrative gains traction Tillie Walden uses them to give depth. Also, as things change in her life, she began to change her artistic style.

Mapping Spinning Reflection

Similar to nearly all the assignments we have completed thus far, Mapping Spinning enabled me to see themes vividly through visualization rather than sheerly textual analysis. I understand Spinning more as a progression of a struggling girl’s adolescence than I did before.  Obviously this is a narrative of the story, but when I see it through, for example, the bar chart of the first and last one hundred pages, I can notice a progression.  In my interpretation, though Walden has stated there was indifference, the yellow exemplifies significant and more dramatized moments.  With this principle, it is logical to see the intensity build up through the book.  Especially this is notable where, through this sequence, Tillie quits skating, has the car crash encounter, and has the sexual assault incident.  Without analyzing these through visual representation, it would be difficult to see.  This, also, pertains to how you can see the themes flowing through the tree diagram.  The question that led me to analyze the feature of the illustration was to discover the significance of the yellow coloring.  Another was to uncover the main themes and how they connect to each other in the scope of a coming of age story.

My map took its shape because I wanted to incorporate qualitative and quantitative data together.  I decided to us eh helpful Data Visualization Catalogue in order to explore my best options in displaying the data.  Rather than using only one, I wanted to gather a firm argument by having three pieces of evidence.  A limitation of my map is that it does not have a definitive explanation through visualization.  True, I draw my conclusions through my textual analysis, it is not displayed in its own chart.  A strength to my map is that it extracts key information of the comic that illustrate the main ideas of Tillie’s experiences.  It brings her story together concisely, comparatively, and vividly.

Mapping Spinning Reflection

I set out to map something about Spinning by Tillie Walden, but what that something was I didn’t know. I had skimmed the book multiple times, looking for different visual or textual patterns but couldn’t make out anything too anomalous that might inspire me. However, when I was skimming, I did realize that there are surprisingly few male characters in the graphic novel. What then came to mind was: why was that? While looking for a possible reason for why there were so few males, I noticed that a lot of the male characters Tillie interacts with in the novel have a bad influence/effect on her. The skating coach in New Jersey was nothing but a taskmaster to her, the SAT tutor sexually assaulted her, even her own twin brother turns from friend to dissenter when Tillie tells him that she’s gay. I figured that this may have been a reason for including so few male characters; Tille doesn’t have many good experiences with men (at least as portrayed in Spinning)

My map shows how I attempted to quantify the effects of the male characters on Tillie. It is not a map that is totally reflective of my findings (I have some more data that I wasn’t able to fit into the graph) but it got the main points across. I chose the format I did to visually show which males effected her the most and in which ways. I think the use of size and color to show which characters were good or bad, stressful or less so was a good way to simplify the info I’m trying to get across. It is not a perfect map though, the numbers I gave each character are my best approximation of how all the factors I studied reflect on that person and the graph could be more expansive with the amount of topics covered. I spent a long time looking around for different info-graph types and templates but couldn’t find one that fit my needs much better than the one I chose.

I think looking at the book through the graph I created brings attention to the pattern of negative male interactions that some might otherwise miss when reading the book. It is easy to miss just how few men are in the novel and how their interactions with Tillie influence her thought process and life. The graph reveals this pattern which reading the book panel by panel may not make so obvious.

1 2 3 4 5 6 40